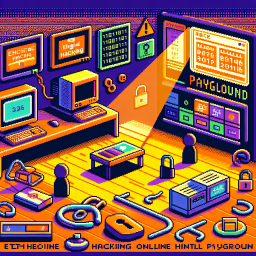
RCE Playground
💻 Can you bypass their advanced input filtering to achieve RCE?
A sophisticated network monitoring platform implements multiple layers of input validation and security controls. But when legitimate monitoring features meet insufficient input sanitization, even the most filtered parameters can become pathways to remote code execution. 🎯 Time to test your filter bypass skills!

 polo
user
polo
user
 Gh0s1h
user
Gh0s1h
user
 kevine
user
kevine
user
 bonginc
user
bonginc
user
 Ichiko
user
Ichiko
user
 myself2025
user
myself2025
user
 H3xCore
user
H3xCore
user
 honkeyponkey
user
honkeyponkey
user
 mikebezi
user
mikebezi
user
 Abo3Leo
user
Abo3Leo
user
 Asefabualrob
user
Asefabualrob
user
 skalvin
user
skalvin
user
 AzmiJO
user
AzmiJO
user
 3xpl0it3r
user
3xpl0it3r
user
 ibarkay
user
ibarkay
user
Command injection is a critical web application vulnerability that allows attackers to execute arbitrary operating system commands on the server. It occurs when applications pass user-controlled input to system command functions without proper sanitization. Command injection consistently ranks among the most severe security flaws because successful exploitation grants direct access to the underlying system, bypassing all application-level security controls.
Understanding Command Injection Techniques
Command injection exploits rely on shell metacharacters that chain or substitute commands within a single input. Common injection operators include semicolons (;) to append commands, pipes (|) to redirect output, logical operators (&&, ||) for conditional execution, and command substitution with backticks or $() syntax. A command injection tutorial typically demonstrates how network monitoring tools, DNS lookup utilities, and system administration panels that accept hostnames or IP addresses are frequent targets, since they often pass input directly to system commands like ping, nslookup, or traceroute.
Input Validation Bypass and Filter Evasion
Modern applications often implement input filters to block command injection, but these filters can frequently be bypassed. Common evasion techniques include using alternative command separators, encoding payloads, leveraging environment variables, using wildcards for command reconstruction, and exploiting inconsistencies between the filter's parsing and the shell's interpretation. Understanding filter bypass techniques is crucial because many applications rely on blacklist-based validation, which is inherently incomplete and can always be circumvented with creative payloads.
Impact and Defense Strategies
Successful command injection gives attackers the ability to read files, access databases, establish reverse shells, and potentially pivot to other systems on the network. Prevention requires avoiding direct system command execution when possible, using parameterized interfaces (like language-specific library functions instead of shell commands), implementing strict whitelist-based input validation, and running applications with minimal operating system privileges. Security testing should include comprehensive fuzzing of all input vectors with command injection payloads.
What You Will Learn
- Understand how command injection vulnerabilities arise in web applications
- Learn advanced injection techniques including filter evasion and encoding
- Practice input validation bypass methods against security filters
- Exploit command substitution and chaining for remote code execution
- Develop skills in identifying injection points in monitoring applications
- Recognize effective defenses against command injection attacks
Prerequisites
Ready to hack this lab?
Create a free account and start practicing cybersecurity hands-on.
Start Your Challenge
New here? Here's what to do
Ready to hack this lab?
Create a free account to start your own dedicated server, submit flags, and earn XP on the leaderboard.
Start Hacking Free